With the 1E integration in TeamViewer, new capabilities have been brought to TeamViewer Monitoring. The updated Remote Task Manager allows administrators to monitor and manage system performance in real-time from any location. It provides immediate insights into CPU, memory, Event Logs, and disk usage, enabling IT professionals to diagnose issues and adjust processes without being physically present at the machine.
This remote access helps reduce downtime by quickly addressing unresponsive or resource-intensive applications and streamlines system recovery efforts. In addition, the Remote Task Manager boosts productivity by centralizing the management of multiple systems and reducing the need for on-site visits.
This article applies to all TeamViewer Monitoring customers using Windows devices.
How to install the 1E Advanced Monitoring solution
Note: Windows x64 and TeamViewer Full Version/Host x64 are required for installation.
The 1E advanced monitoring solution is installed automatically when TeamViewer Monitoring is installed on an endpoint. Once TeamViewer Monitoring is installed, no further action is required in order to start using the associated services.
Deprecation of activation via TeamViewer policy
TeamViewer Host or Full Version 64-bit (x64) version 15.71 or earlier uses a different activation process, where the 1E Advanced Monitoring solution is activated for the devices via a TeamViewer policy. Currently, older versions running the service via TeamViewer Policies will not be affected by this change and will continue to function as normal. It will not be possible, however, to activate new devices running older versions of TeamViewer Remote via TeamViewer Policy. Therefore, it is recommended to update all devices to the latest version of TeamViewer Remote in order to utilize the 1E Advanced Monitoring solution.
Note: Devices that previously had the 1E Advanced Monitoring solution installed via policy will retain the Monitoring services when updating TeamViewer Remote to 15.72.4 or later. No further action would be required on these devices to continue using the 1E Advanced Monitoring solution.
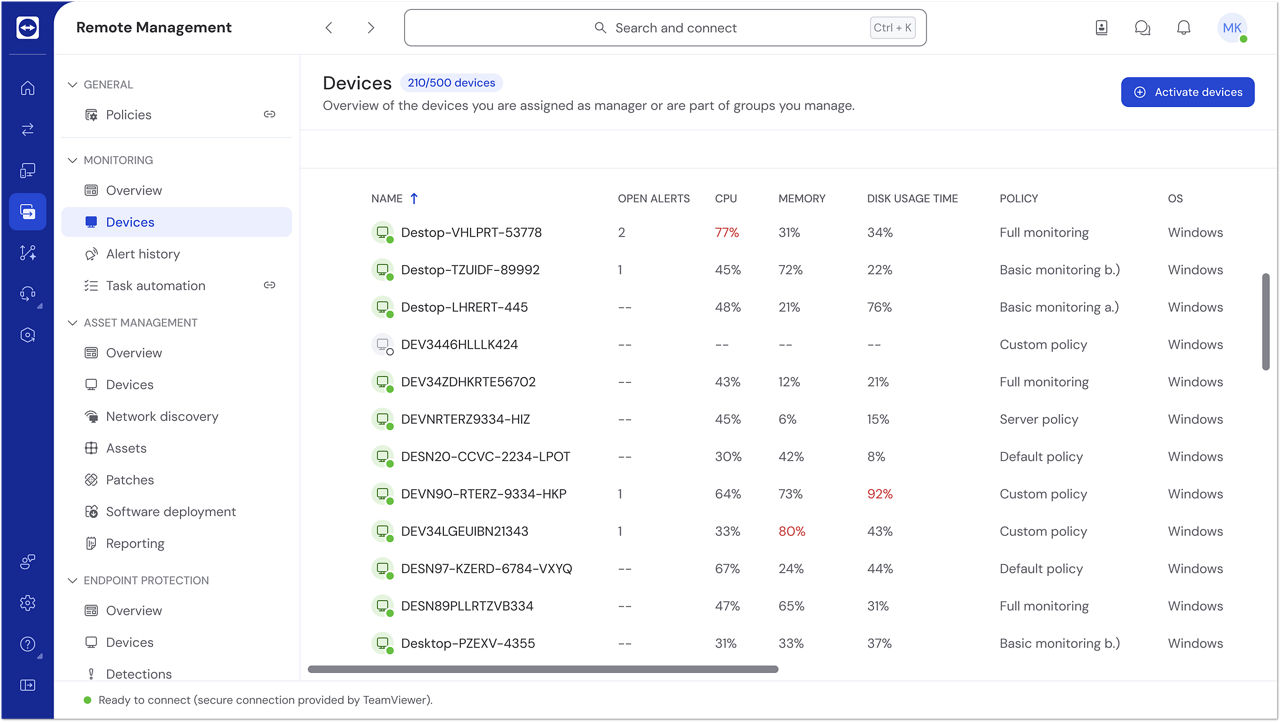
The Devices view
Another feature of the 1E Advanced Monitoring is the live view of all currently monitored devices. On the Devices tab, you can now see the number of open alerts, CPU, Memory, and Disk Usage, as well as the current Policy and OS.
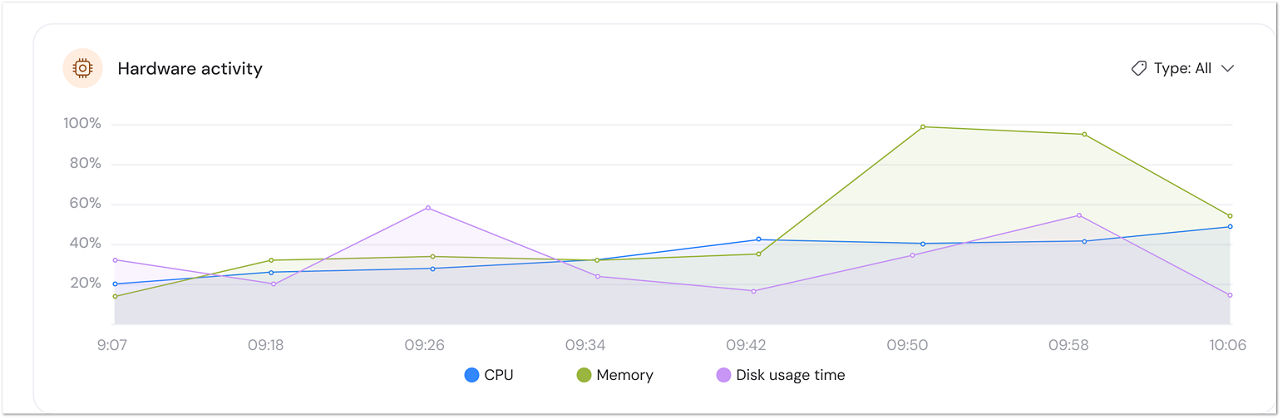
Hardware Activity
The new Hardware Activity graph provides a visual breakdown of the CPU, Memory, and Disk usage time. This graph is visible on all tabs in the Remote Task Manager.
How to access the Remote Task Manager
The Remote Task Manager can be accessed from TeamViewer Remote or the web app.
Step 1
Navigate to the Devices tab under TeamViewer Monitoring. Select the desired device by clicking the device name to open the Device Drawer.
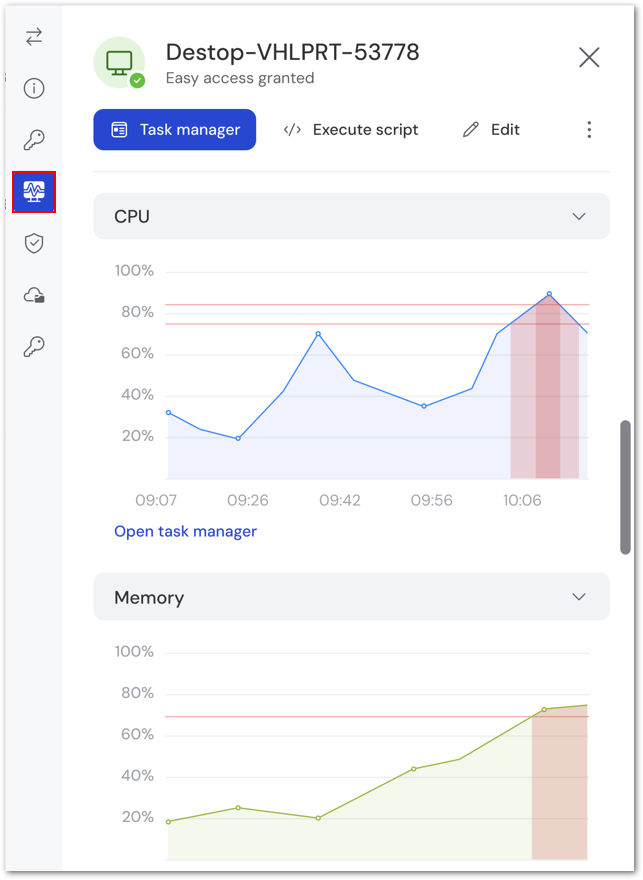
Step 2
Select the Computer icon on the left of the Device Drawer to view active CPU, Memory, and other parameters. Select Task Manager at the top to open Remote Task Manager.
Step 3
Select the desired tab (Processes, Services, or Event Log) to view the current data.
- Processes
- Services
- Event Log
Processes
Accessing the Processes tab lets you view the current processes on a device.
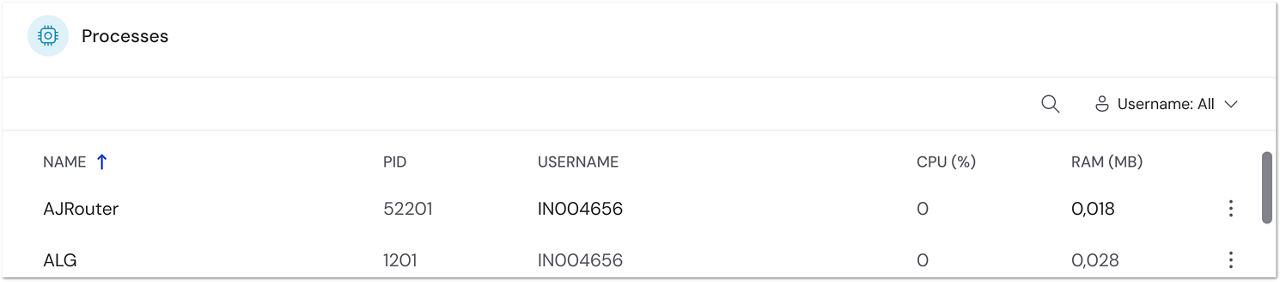
To end a process, select the three-dot menu and choose End Process. To minimize the number of processes seen, you can filter processes based on user- or system-started processes.
Services
Accessing the Services tab lets you view the current services on a device. You can also stop or restart any services on the device by selecting the desired option from the three-dot menu to the right of the service.

Event Log
Accessing the Event Log tab lets you view all Event Logs on a device.

Additional details regarding the Event Log can be viewed via the three-dot menu to the right of the Event Log. This will produce a new window providing all details regarding the specific log.