TeamViewer Engage provides you with various statistics which are rehashed in different dashboard views. You find the Dashboard in the main menu on the left.
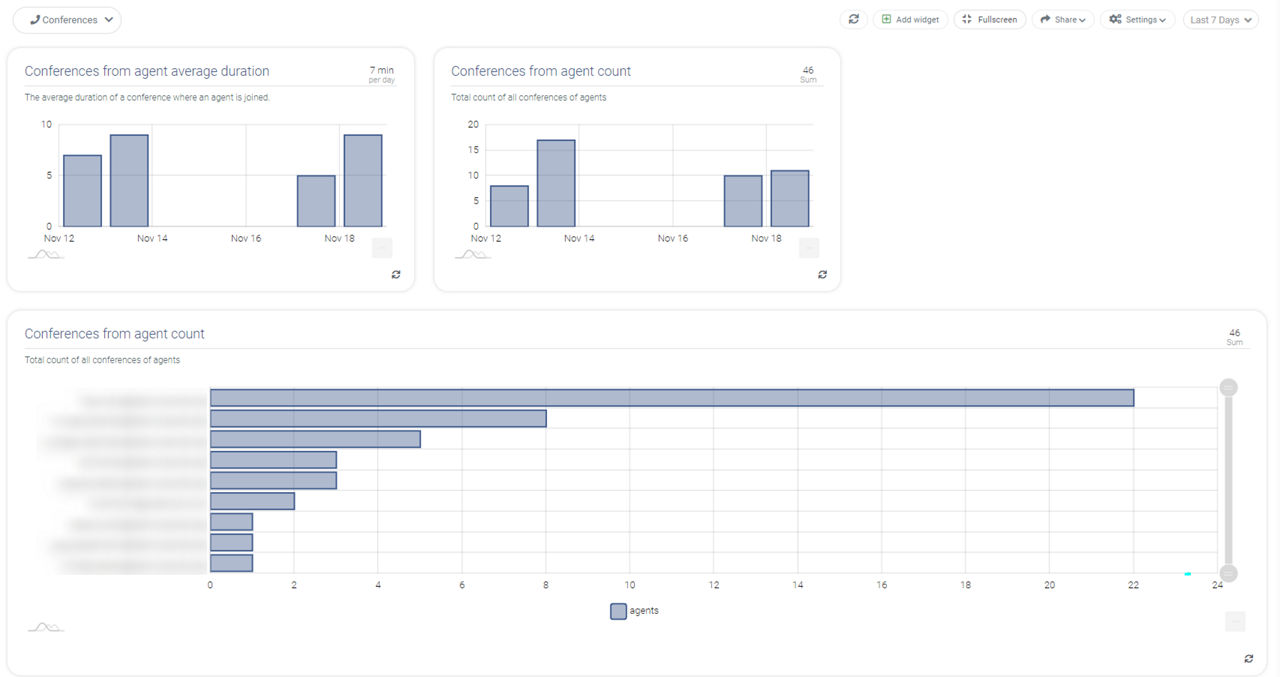
Customize your Dashboard
Create a new Dashboard

You can customize current Dashboards just as you like. If needed, you can simply add a new Dashboard to fit all your requirements by clicking on + New Dashboard.
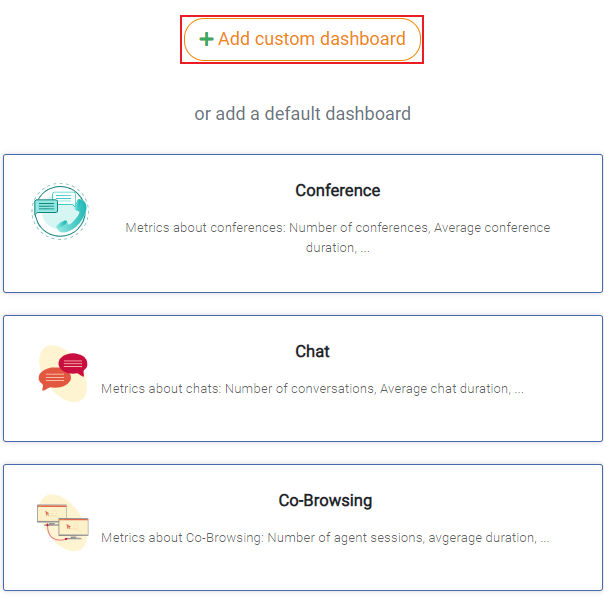
Afterwards you can choose to create a custom dashboard or add a default one. To add a custom dashboard simply click + Add custom dashboard
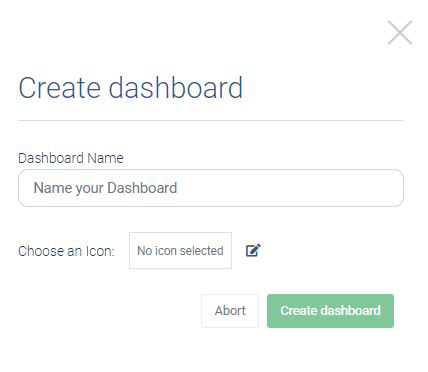
Before the dashboard can be created, it has to be given a name. Optionally you can add an icon to identify the dashboard faster afterwards.
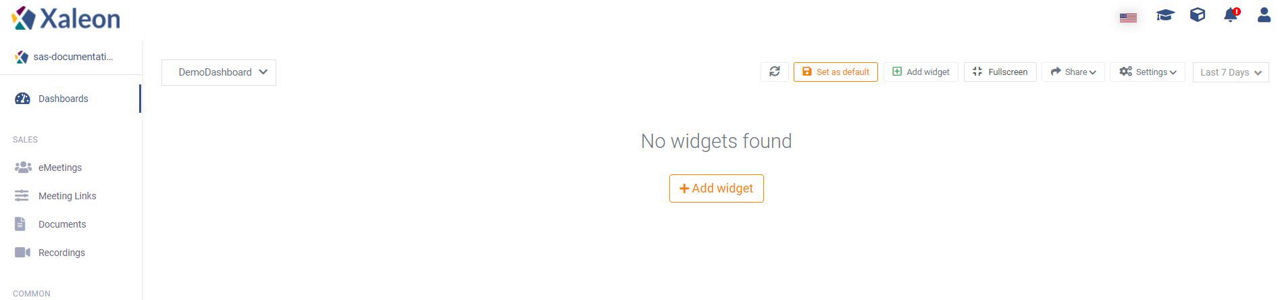
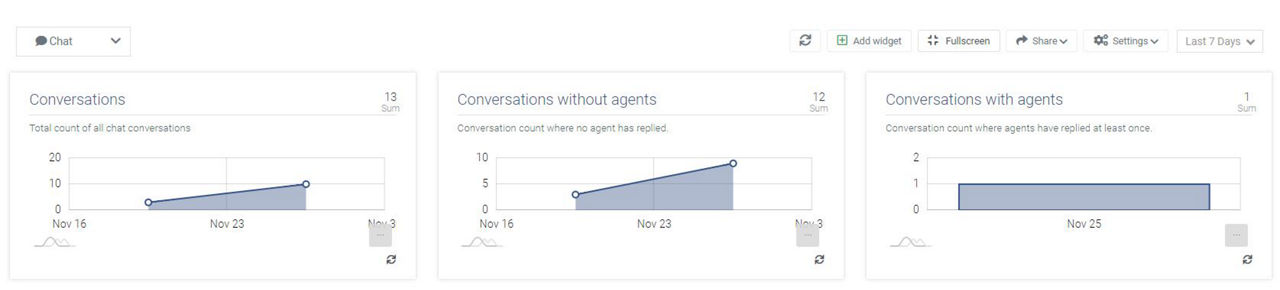
After the dashboard has been created, it can be set as default by clicking the Set as default button. Furthermore, you can add widgets to view statistics of your TeamViewer Engage-Console. To add widgets press the Add widget button.
Add new Widgets
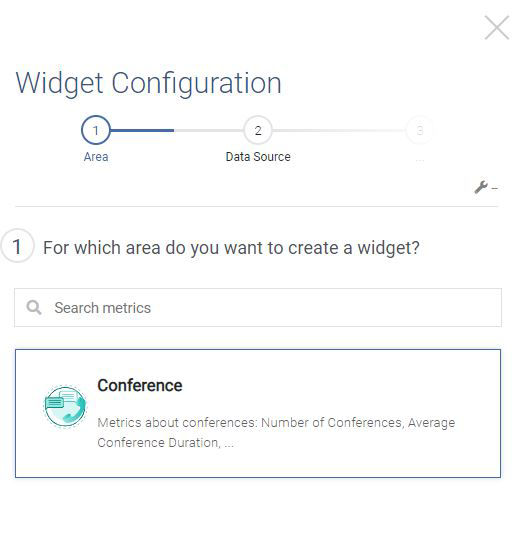
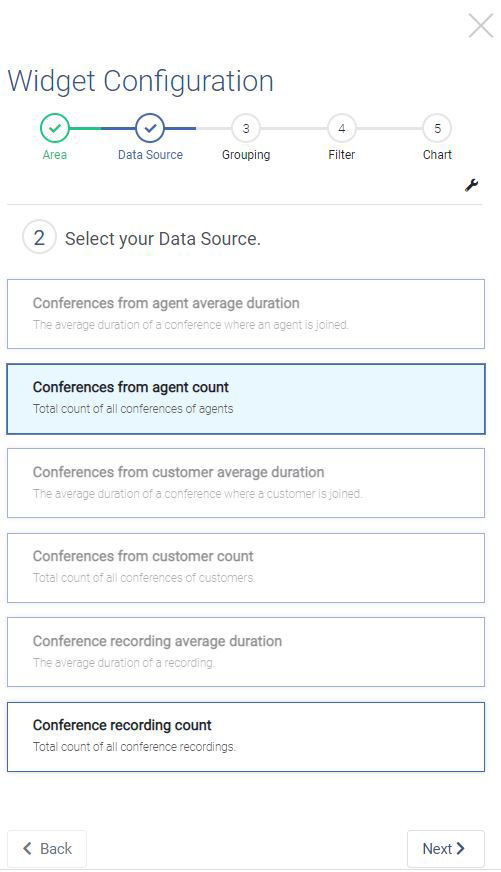
When clicking on the Add widget button, the Widget Configuration window shows up where you can configure your new widget. You can choose from different categories to select your statistic data. Depending on your selection, you can choose from various Data Sources.
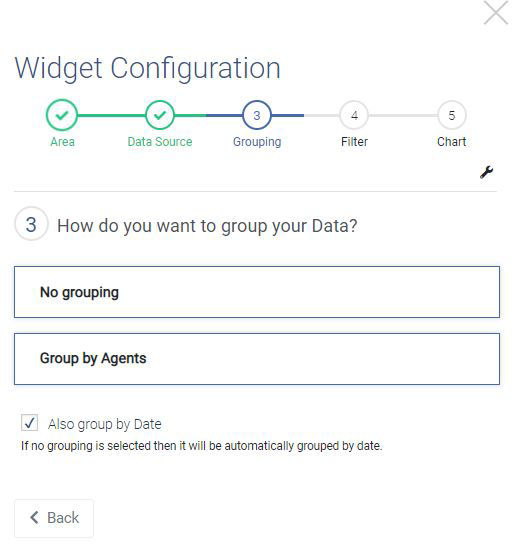
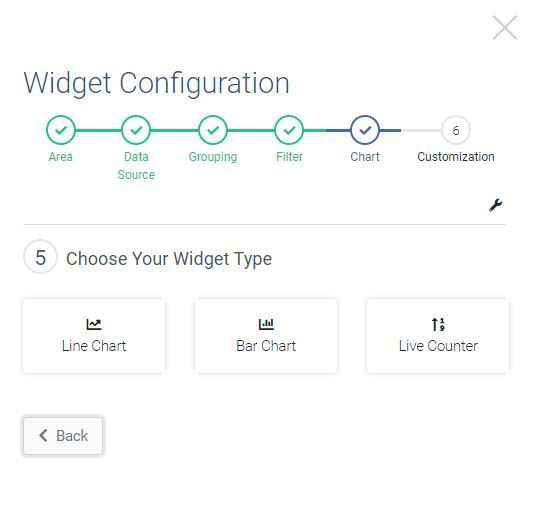
Then you have to select the type of representation.
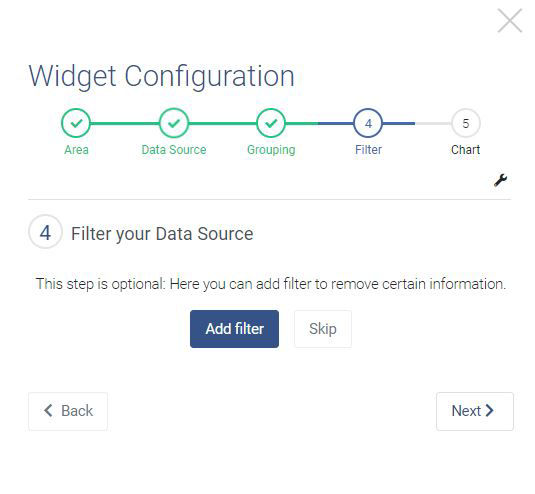
Optionally you can add a filter.
Then a chart type has to be selected.
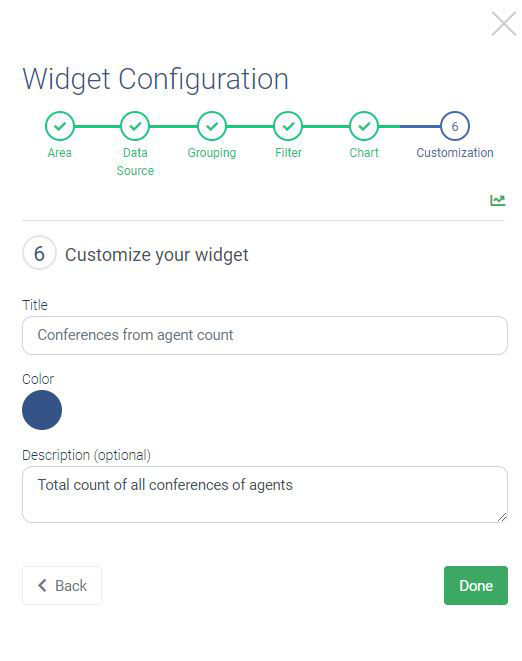
At last you can configure the title, color and the description (optional).
Edit Mode
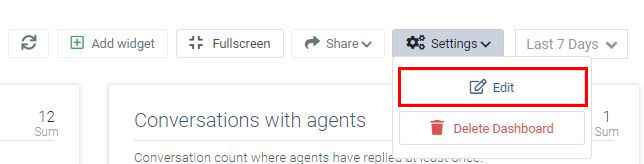
The currently selected dashboard can be editted by clicking on Settings and then Edit. You can also delete the dashboard by clicking on Delete Dashboard.
While the edit mode is active, you can drag and drop the widgets as you like. Additionally, you can filter, group edit and delete the current widgets. The edit mode can be closed by clicking on the Close edit mode button in the top right corner