Threatdown Endpoint Detection and Response (EDR), powered by Malwarebytes, offers continuous protection for your endpoints against all types of threats; Managed Detection and Response takes this protection further by providing high-precision responses to threats. By reducing the dwell time of critical threats and providing a faster Mean-Time-To-Resolution (MTTR), EDR continues to provide businesses with measures to save costs, reduce downtime, and increase the overall effectiveness of threat hunting.
This article applies to Endpoint Detection and Response customers with the MDR add-on.
Features of Managed Detection and Response
- 24x7x365 Security Monitoring uses Endpoint Detection and Response (EDR) technology and human expertise to monitor endpoint activity for suspicious events.
- Advanced threat detection utilizing sophisticated tools and techniques like threat intelligence and behavioral analysis to identify and stop even the most novel threats
- Threat detection and analysis by trained security professionals to determine any detected threat's severity and potential impact.
- Threat hunting, where security analysts actively search for hidden threats within the network.
- Flexible remediation options ensure that the MDR team can actively remediate threats as they are discovered or provide highly actionable guidance for IT teams to follow in their remediation efforts.
First steps
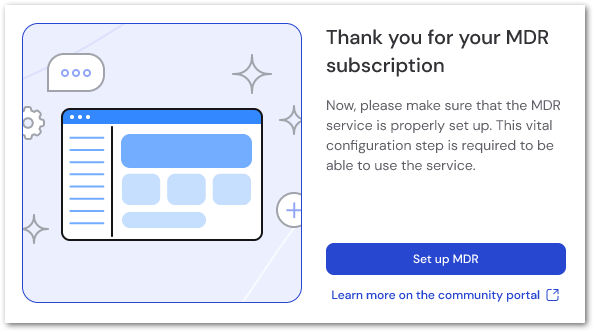
Once the service is activated in your account, TeamViewer will confirm via a pop-up. Select the Setup MDR button to proceed to the initial setup.
Set up the primary, backup, and alternate contacts on the next screen. Select the primary contact drop-down menu and select the desired member of your company profile. If not automatically entered, insert this contact's primary phone number.

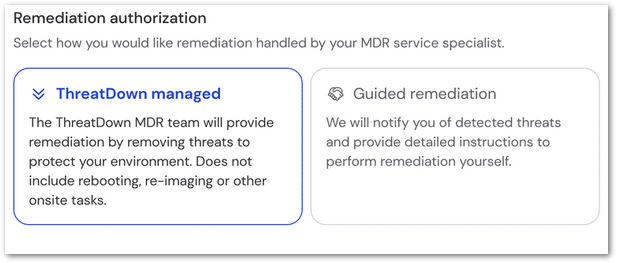
In the Remediation authorization section, select whether you prefer ThreatDown managed or Guided remediation for any threats encountered:
- If ThreatDown managed is selected, the threats will be remediated automatically without reboots, re-imaging, or other tasks.
- If Guided remediation is selected, you will be guided through steps to remediate potential threats, including the need for other potential tasks such as reboots.
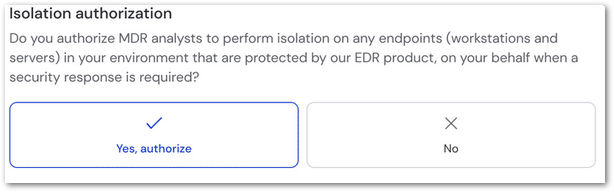
In the final section, Isolation authorization, choose whether or not you authorize endpoints to be isolated on your behalf when a security response is required. This authorizes both workstations and servers.
Once completed, click Save in the upper right corner of the screen. A pop-up notification indicates that Managed Detection and Response has been activated successfully.
How to access the MDR Portal
The Managed Detection and Response (MDR) Portal manages all aspects of the service. It can be accessed by selecting the Nebula button, which can be found in settings or the detections tab. Once in Nebula, select Managed Services to see all Cases and Incidents reported.
Discover the MDR Portal
The MDR Portal, powered by ThreatDown, is the control dashboard for your license. The Managed Services tab is within the portal, where you can view all MDR reports and take any necessary actions.
Managed Services is broken into two main sections:
Overview
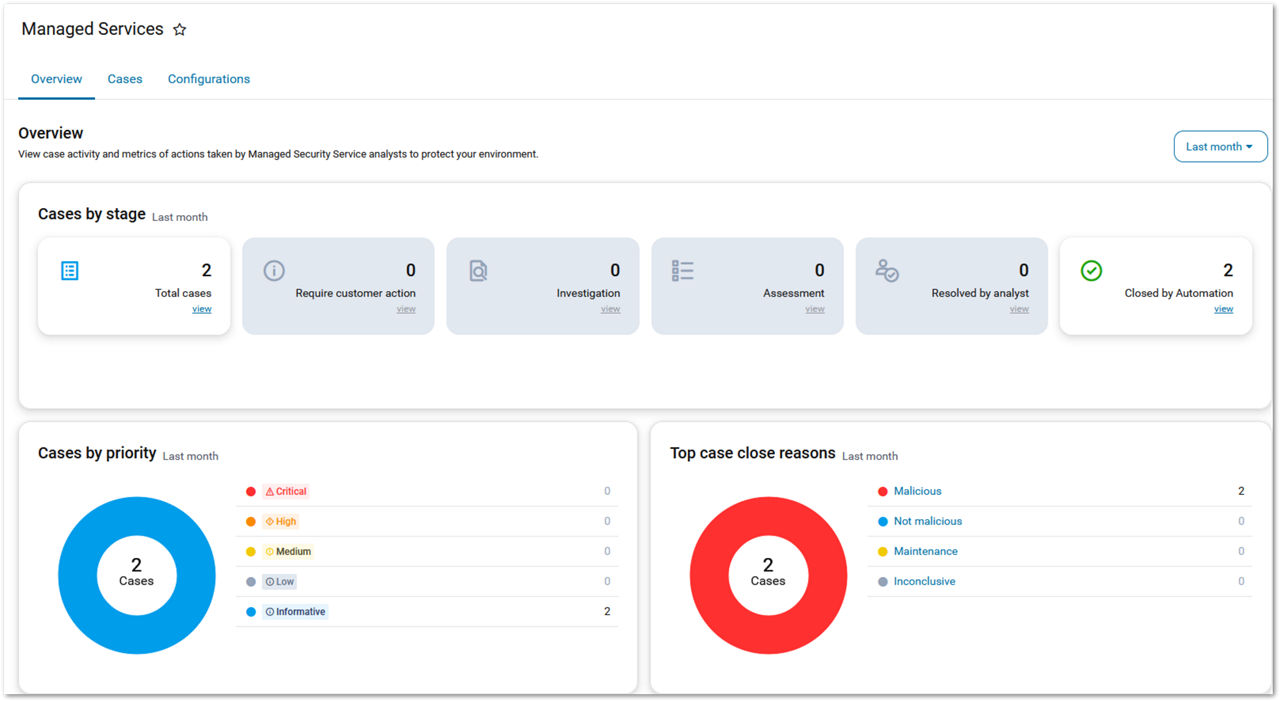
The Overview tab provides a centralized, high-level summary of your Managed Services cases through a collection of interactive widgets. These widgets are designed to offer at-a-glance insights into case activity, helping users monitor and assess the security posture of their Nebula environment effectively. By presenting concise and relevant data, the Overview tab serves as a starting point for understanding trends, identifying areas of concern, and prioritizing actions.
This tab is particularly useful for quickly understanding malicious activity in your environment. It supports time-specific filtering, allowing users to narrow the scope of displayed information to a particular period. This functionality makes analyzing trends or investigating incidents easier within a chosen timeframe.
The following widgets are available on the Overview tab, each serving a specific purpose:
- Cases by Stage: This widget provides a general overview of case activity by categorizing cases based on their current stage in the incident response lifecycle. This helps users track case progress, such as whether they are newly opened, under investigation, or resolved.
- Cases by Priority: This widget displays the number of open cases grouped by their priority level. Highlighting the urgency of each case allows users to quickly identify high-priority cases that may require immediate attention, ensuring critical issues are addressed promptly.
- Top Case Close Reasons: This widget identifies the most common reasons for closing cases as determined by analysts. Summarizing these trends provides valuable insights into the recurring factors driving case resolutions, helping teams optimize their response strategies and improve future outcomes.
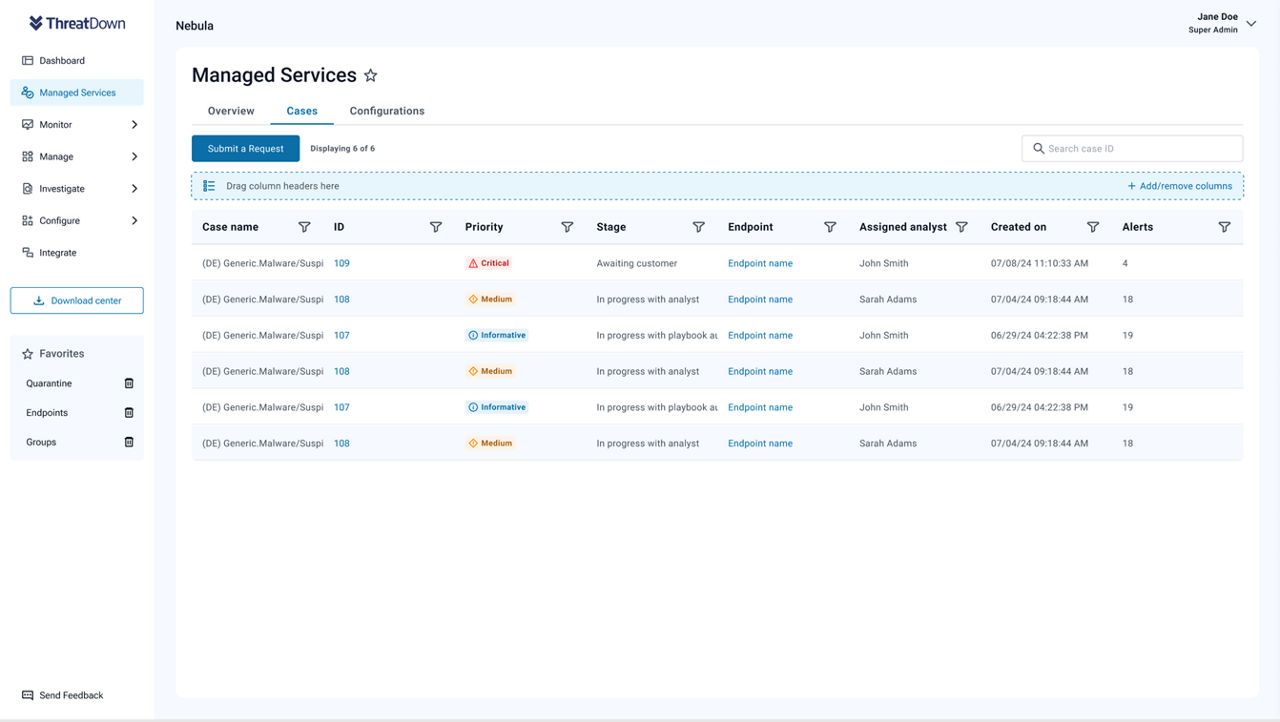
Cases
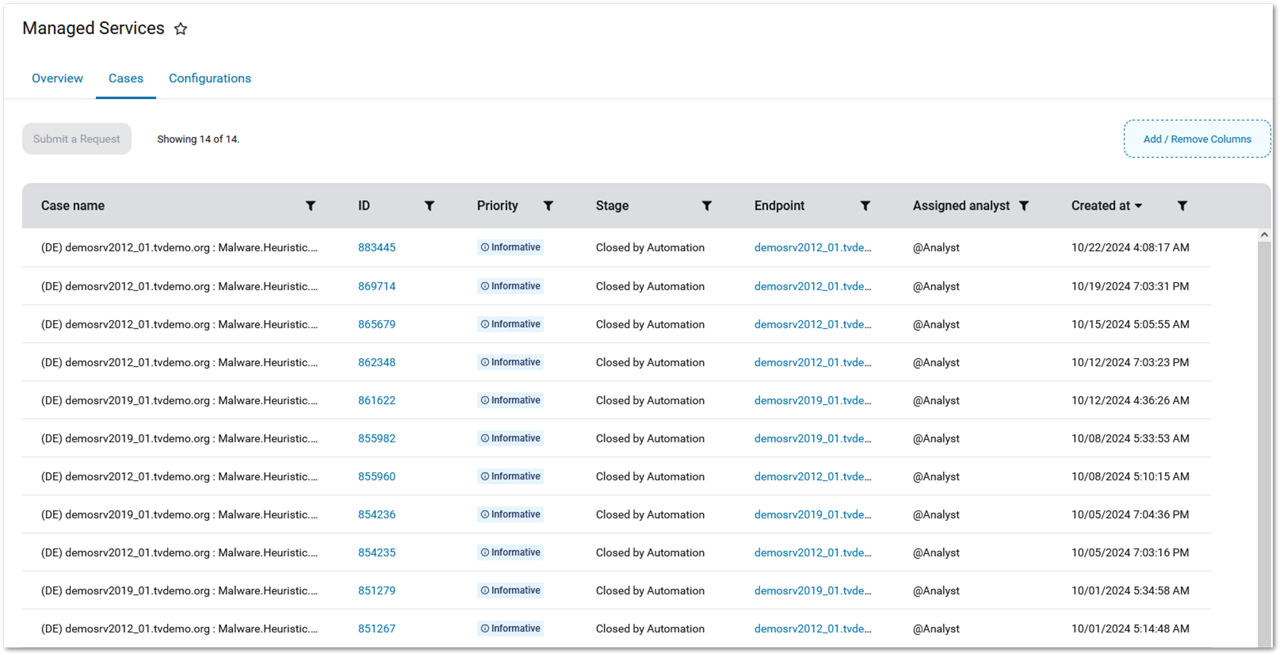
The Cases tab on the Managed Services page displays a list of open cases and their details. The following information is available on the Cases tab:
- Alerts: Number of detections tied to the case.
- Assigned analyst: Analyst assigned to the case.
- Case name: Detection (DE) or Suspicious Activity (SA) followed by the endpoint name and path of the detection.
- Close reason: Reason the analyst closed the case.
- Closed at the time the case was closed.
- Created at: Time the case was opened.
- Endpoint: Name of the device with the alerts.
- ID: ID number for the case.
- Priority: Urgency of the case.
- Stage: Current phase of the case.
- Status: Opened or closed case.
- Updated at: Last time the case was updated.
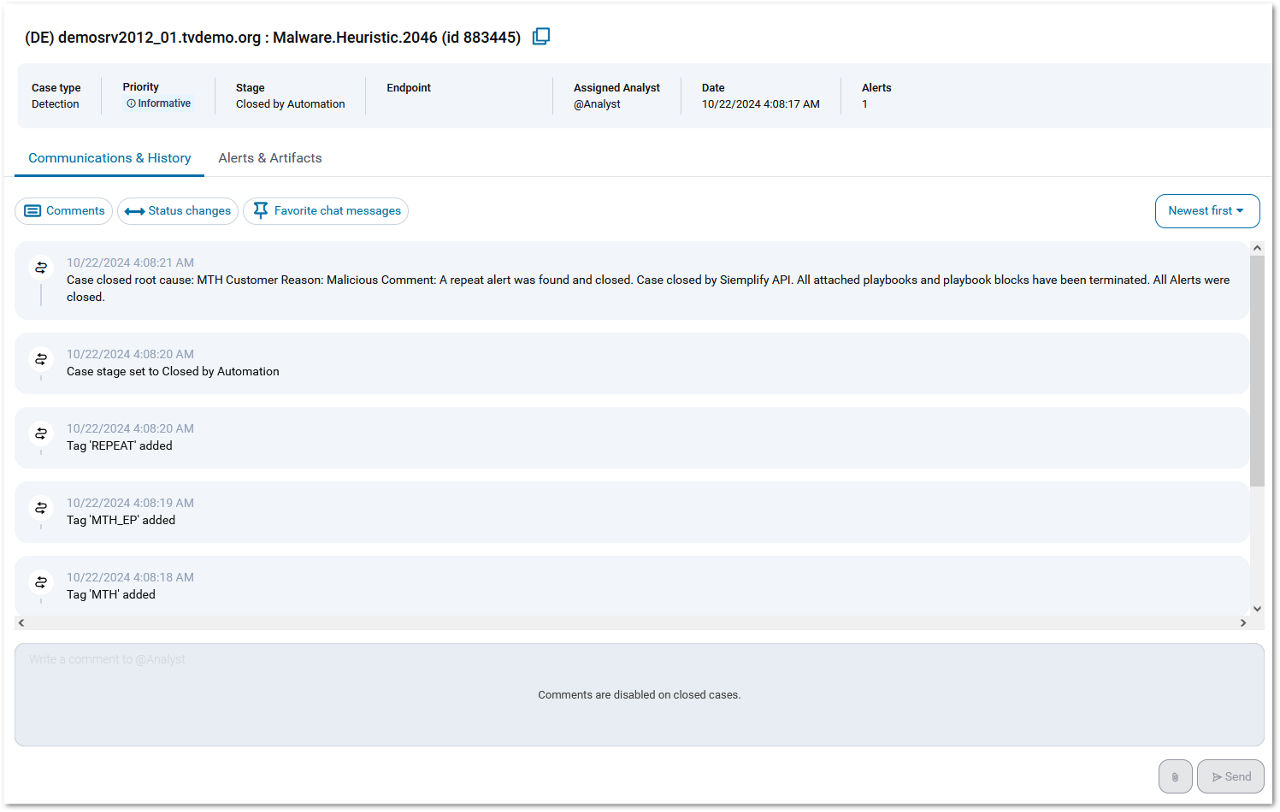
How to view Case Details
To view the details of any MTH case, click the ID number in the ID column. This will produce the following information in a new drawer:
- Communications & History
The Communications & History tab within the case details slideout provides a comprehensive case activity record. This includes communications between analysts, detailed remediation instructions, and a log of actions taken during the investigation.
To refine the information displayed, you can use the icons to filter specific events, such as comments, status updates, or other key changes, ensuring quick access to the most relevant details.
- Alerts & Artifacts
A single case may encompass multiple alerts, often representing several interconnected malicious activities occurring on the same endpoint. These alerts are grouped together to streamline analysis and enhance context. The Alerts & Artifacts tab allows you to review a case's associated alerts and related items. For deeper investigation, the Go to detection button next to each alert provides direct access to the specific detection or suspicious activity tied to that case.
How to submit a request about a case
If you have a question on an MDR case:
- Click Submit a Request.
- Enter the case number of the case you have a question on.
- Select a priority
- Enter a description
- Click Submit.
How to set up Managed Detection and Response to optimize the protection of your endpoints
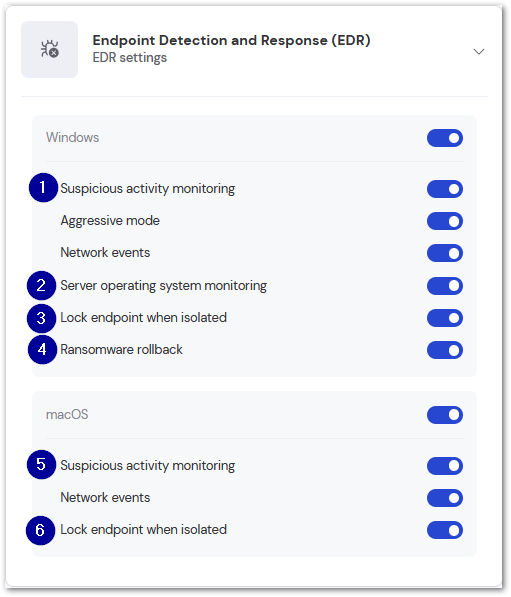
Managed Detection and Response require specific settings from EDR to operate successfully. These settings are found in the Endpoint Protection policy settings. To access this, navigate to the Admin Settings and select Policies under Device Management. If you already have a policy created, you can edit this one; otherwise, you can create a new policy by selecting Endpoint Protection from the policy drop-down. Please ensure the following settings are active under the appropriate OS:
- Windows
- macOS
- Suspicious activity monitoring
- Server operating system monitoring
- Lock endpoint when isolated
- Ransomware rollback
5. Suspicious activity monitoring
6. Lock endpoint when isolated
How to optimize threat scans
Scans of endpoints for potential threats are an integral aspect of the security setup. We recommend at least two kinds of scans:
- Daily Scan
- Weekly Scan
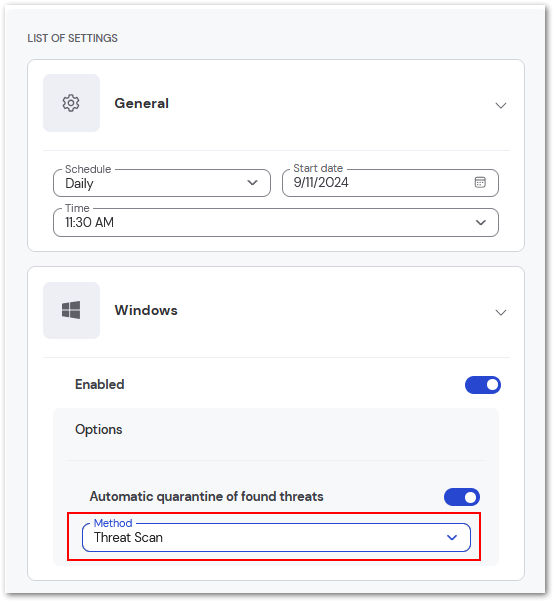
Select Daily from the Schedule drop-down in General. Under Windows, select Threat Scan from the Method drop-down.
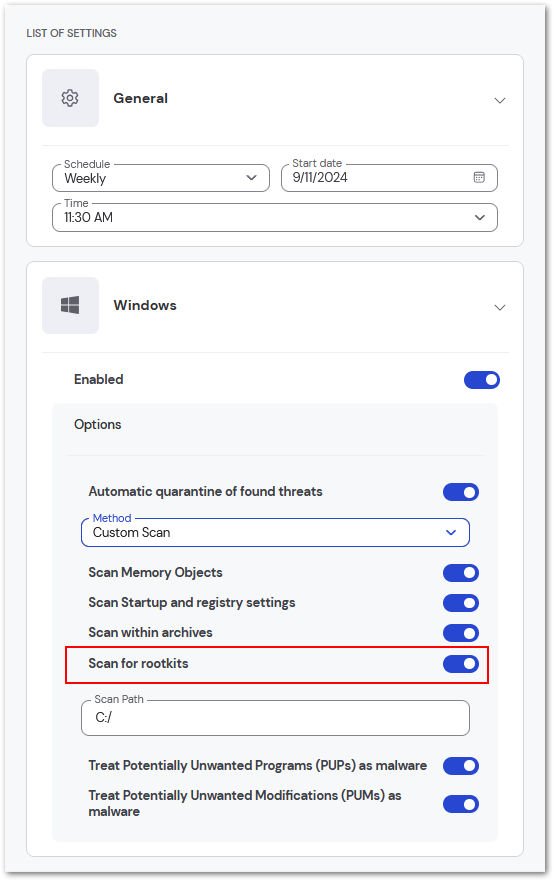
Select Weekly from the Schedule drop-down. Set the Method to Custom Scan, and turn on Scan for rootkits.
How to ensure efficient notifications
Setting up all necessary notifications is important to ensure you and your team stay alert of potential threats. The following information pertains to notifications specifically for Managed Detection and Response.
When creating a new notification, select Managed services activity.
It is recommended that some conditions be added regarding when notifications are sent. This ensures that your admins don't become overburdened with messages that don't require their attention.
Select each field option below to see its available values:
- Event type
- Priority
- Action required
is equal to
- All
- Case created
- Case updated
- Case closed
is equal to
- All
- Critical
- High
- Medium
- Low
is equal to
- True
- False
In the next section, select how the notifications should be sent. In addition to email, you can select to be notified via Slack/Microsoft Teams, Webhook, or the ThreatDown Admin app.
In the final step, aggregation can be activated, reducing the notifications received and allowing for more focus. This consolidates multiple alerts into single notifications based on the interval and grouping option you select, along with previously chosen activity types, conditions, and delivery methods.
Select Complete in the bottom right corner to save the new notification.